Project / 06
Midterm Control Room
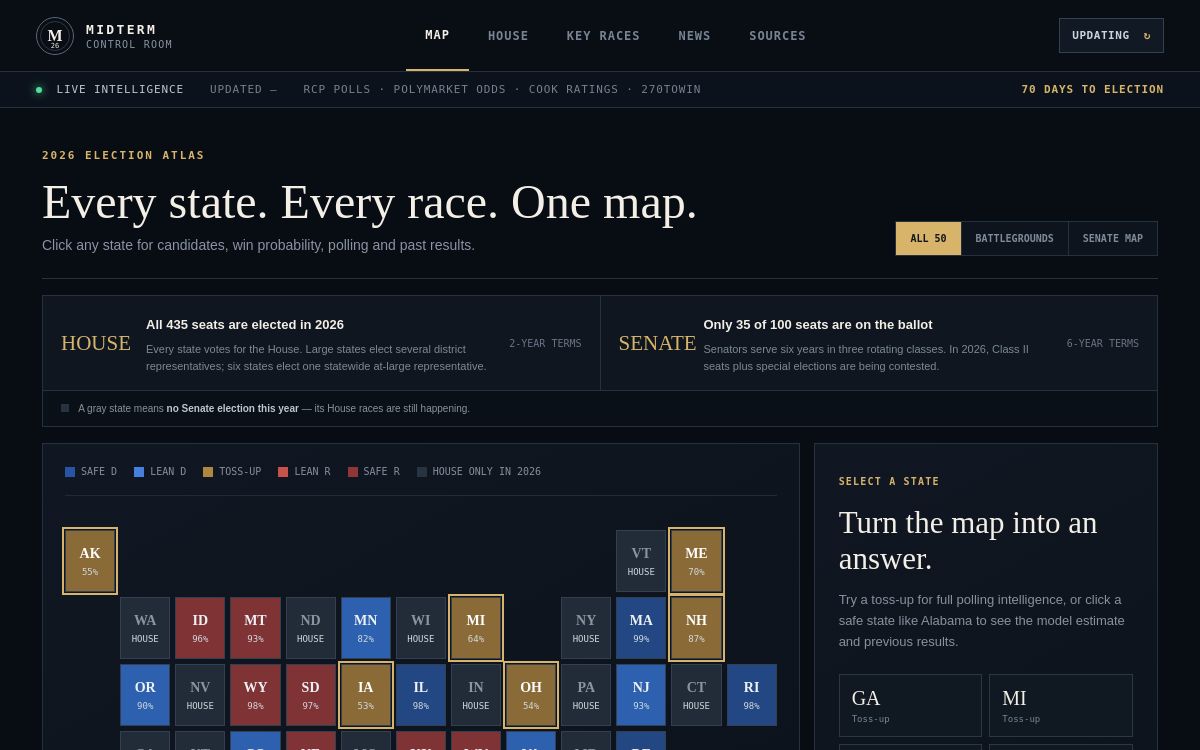
I built Midterm Control Room to bring the most useful information about the 2026 U.S. midterms into one place, instead of switching between markets, news feeds and individual race pages.
The dashboard explains how House and Senate elections differ, highlights the contests most likely to affect chamber control, and gives each race its own candidate and state context.
It combines prediction-market probabilities, social signals, reference information and recent news. The goal is to make a complex election cycle easier to explore, not to provide an official forecast.
What I wanted to understand
Create one clear interface for understanding which races matter for control of Congress, what markets currently imply and what new information may be moving the picture.
What the project covers
- Explain the electoral structure: every House seat is contested while only one class of Senate seats is up in a given cycle.
- Identify and organise the House and Senate races most relevant to chamber control.
- Present candidate-level context and race-specific market information rather than a single national midterm percentage.
- Combine prediction-market data, social signals, reference material and the seven latest relevant news stories.
- Expose source-status indicators so unavailable feeds are visible rather than silently replaced.
What came out of the comparison
- A single live dashboard connects the national balance-of-power question with the individual races that can decide it.
- Race pages separate candidate and state context from broader national market probabilities.
- The interface refreshes external information while keeping source availability visible to the user.
This is an information and monitoring tool. Market prices and social signals are noisy, can move quickly and should not be interpreted as certain election forecasts.
What the result does not claim
The dashboard depends on third-party APIs and public feeds that may be delayed, unavailable or incomplete. Prediction-market probabilities reflect prices and liquidity rather than objective truth, while news and social data may contain bias or noise.
Live dashboard